2021 Census
Introduction
A census is a count of the population which takes place in the UK every ten years. It's carried out by the ONS (Office of National Statistics) and asks everyone to share information about the people in their households. This information helps government and local authorities plan, fund and deliver important everyday services like housing, education healthcare and transport.
The 2021 census day was 21 March 2021 and the first set of data was released on 28 June 2022.
Data included in the current release:
- population estimates
- gender
- 5 year age groups
- land area
- number of households
Further information about this data can be found on the ONS website.
Dashboards
We also publish detailed analysis of the census on dashboards, which can be accessed using our census dashboards page.
If you would like specific information from the latest census, please contact us directly rather than filling out a Freedom of Information request.
Key findings
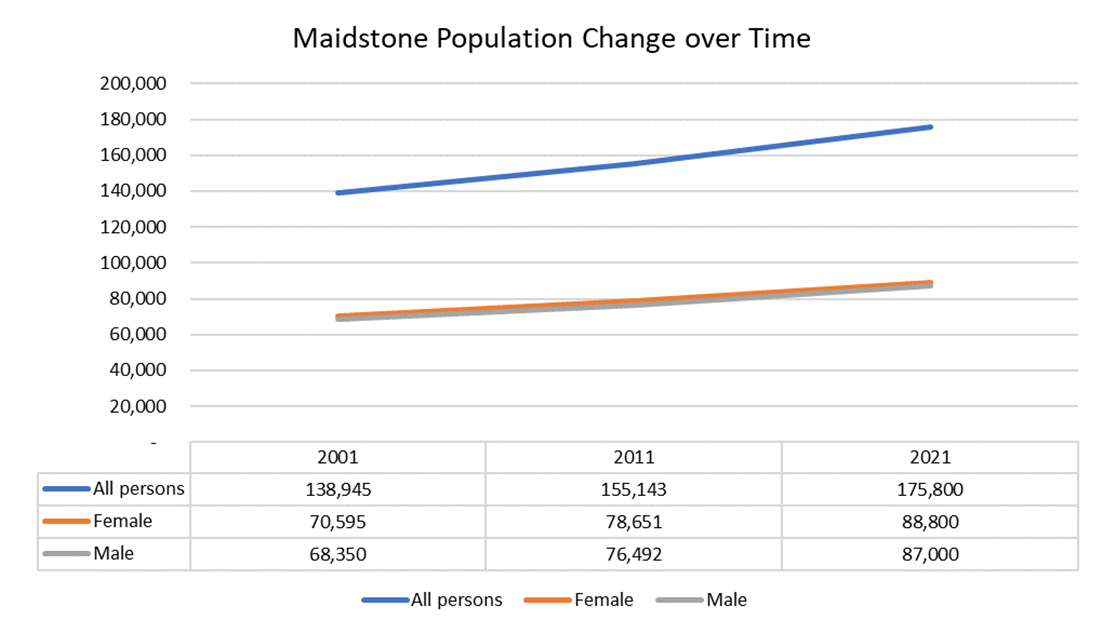
- The total population of Maidstone was 175,800 on 21 March 2021, census day. It has grown by 13.3% since the 2011 census (155,143).
- Of all of the local authority districts in Kent, Maidstone has the largest population with 175,800 people. Gravesham has the smallest population with 106,900 people.
- As in previous years, there are more female residents than male residents in Maidstone. 50.5% (88,800 people) residents are female and 49.5% (87,000) are male. This pattern is seen in all of Kent’s local authority districts.
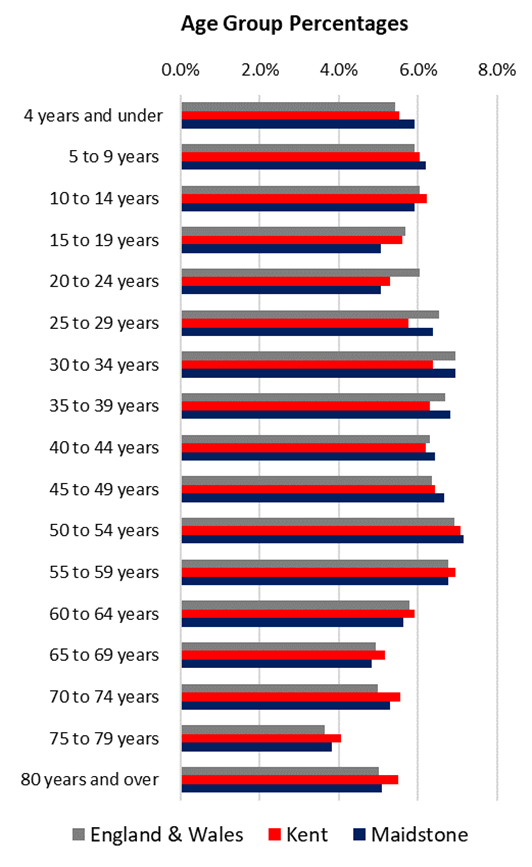
- Maidstone has a slightly greater proportion of middle-aged people compared to the total for Kent and England; with 34.0% aged 30 to 54 years whereas Kent has 32.4% and England has 33.2% in this grouping.
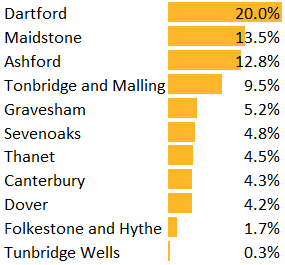
- Maidstone's population density saw a growth of 13.5% against the 2011, increasing from 394 to 447 usual residents per square kilometre.
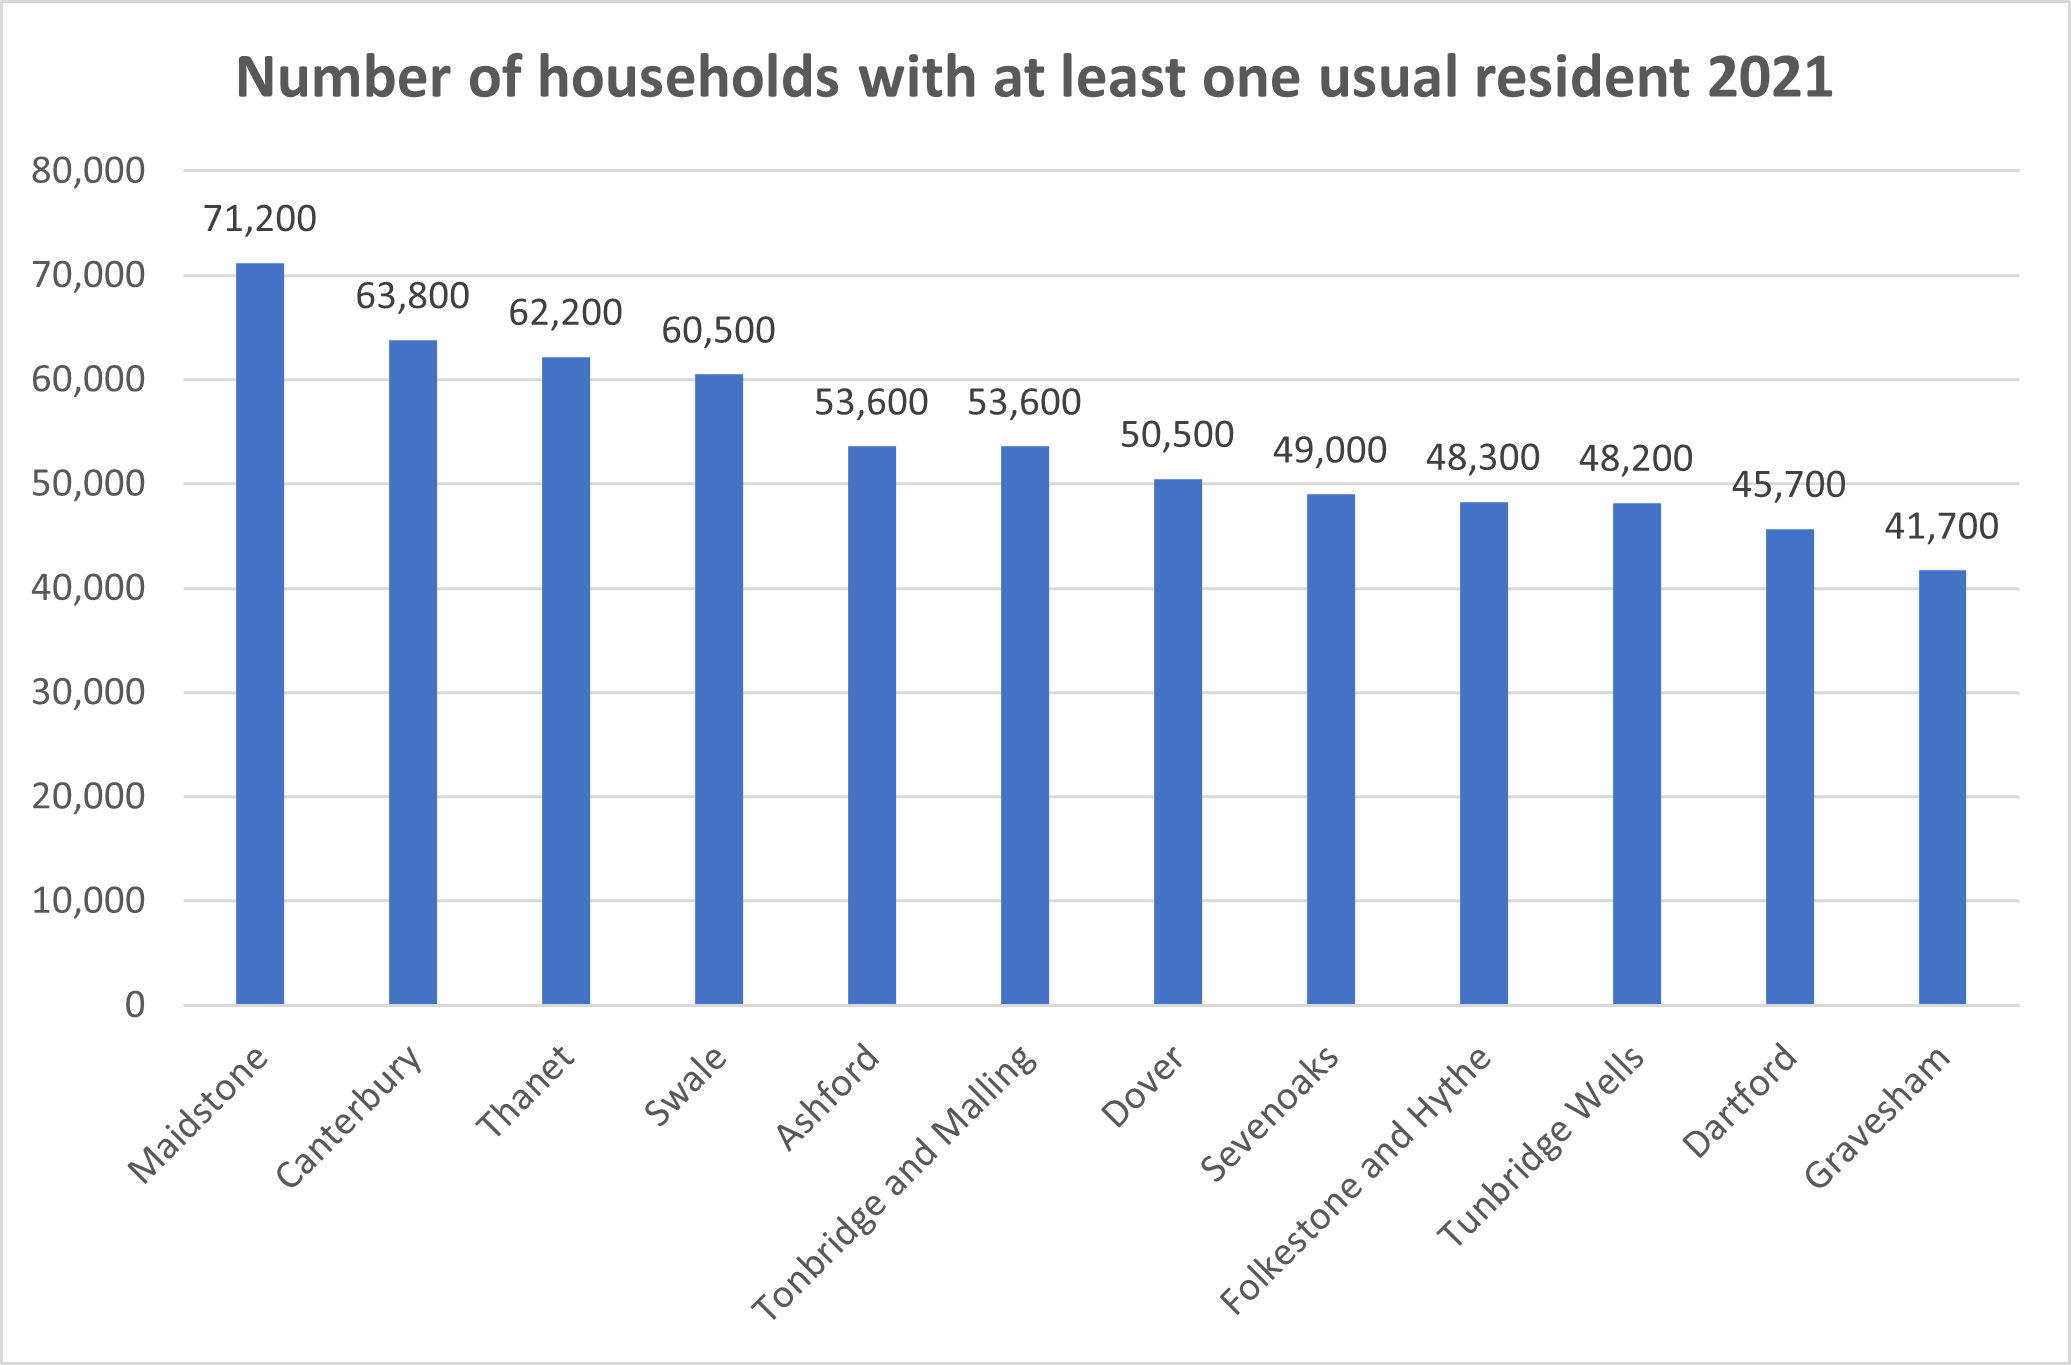
- The number of households with at least one usual resident in Maidstone on census day was 71,200 - this was the largest figured when compared to the other local authorities in Kent.
Population estimates
On census day, the size of the population in England and Wales was 59,597,300, which shows an increase of 6.3% from 2011. However, the rate of population growth was lower than in 2011, when it showed 7.8% growth against 2001 (4.0 million).
The total population of Kent (excluding Medway) is 1,576,100 for 2021, which shows an increase of 7.1% compared to the 2011 and is lower than the increase in population between 2001 and 2011 (10.1%).
Based on the latest Census data, the population in Maidstone in 2021 was 175,800 which showed a 13.3% increase since 2011. For comparison, an increase in the population growth rate between 2001 and 2011 was 11.7%. In 2011, Maidstone had the largest increase in population when compared to the rest of the districts in Kent. In 2021, however, Dartford had the biggest increase (20%) in the population and Tunbridge Wells the lowest population increase (0.2%).
In 2021, Maidstone ranked 115th for a total size of the population out of 309 local authority areas in England, moving up six places from 2011.
Age and 5 year age gap
Overall, in England, there has been an increase of 20.1% in people aged 65 years and over, an increase of 3.6% in people aged 15 to 64 years, and an increase of 5.0% in children aged under 15 years.
In Maidstone, there has been an increase of 26.3% in people aged 65 years and over, an increase of 9.7% in people aged 15 to 64 years, and an increase of 14.1% in children aged under 15 years.
In terms of five-year age groups, the 70 to 74 years group increased by 48.3% and the 75 to 79 year group increased by 34.2%. There was a decrease of 5.3% in the number of 40 to 44 year-olds and a 4.0% decrease in the number of 15 to 19-year-olds.
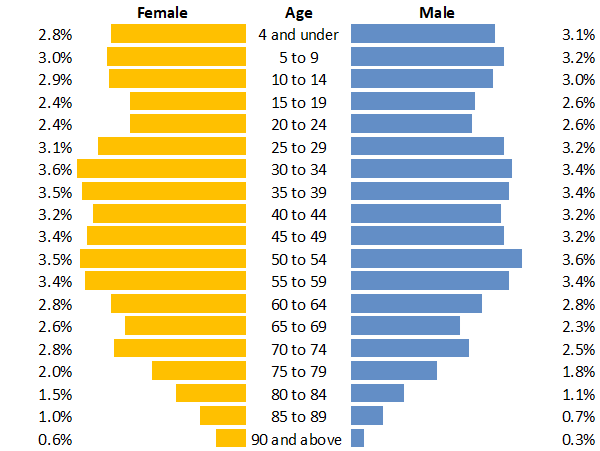
Maidstone has lower proportions of 15 to 19-year-olds and 20 to 24-year-olds compared to both England and Wales overall and compared to Kent and greater proportions of those 4 years and under and of 45 to 49-year-olds.
Gender
Overall, there were 30,420,100 women (51.0% of the overall population) and 29,177,200 men (49.0%) in England and Wales in 2021. Compared to 2011, 50.8% of the population were female and 49.2% were male.
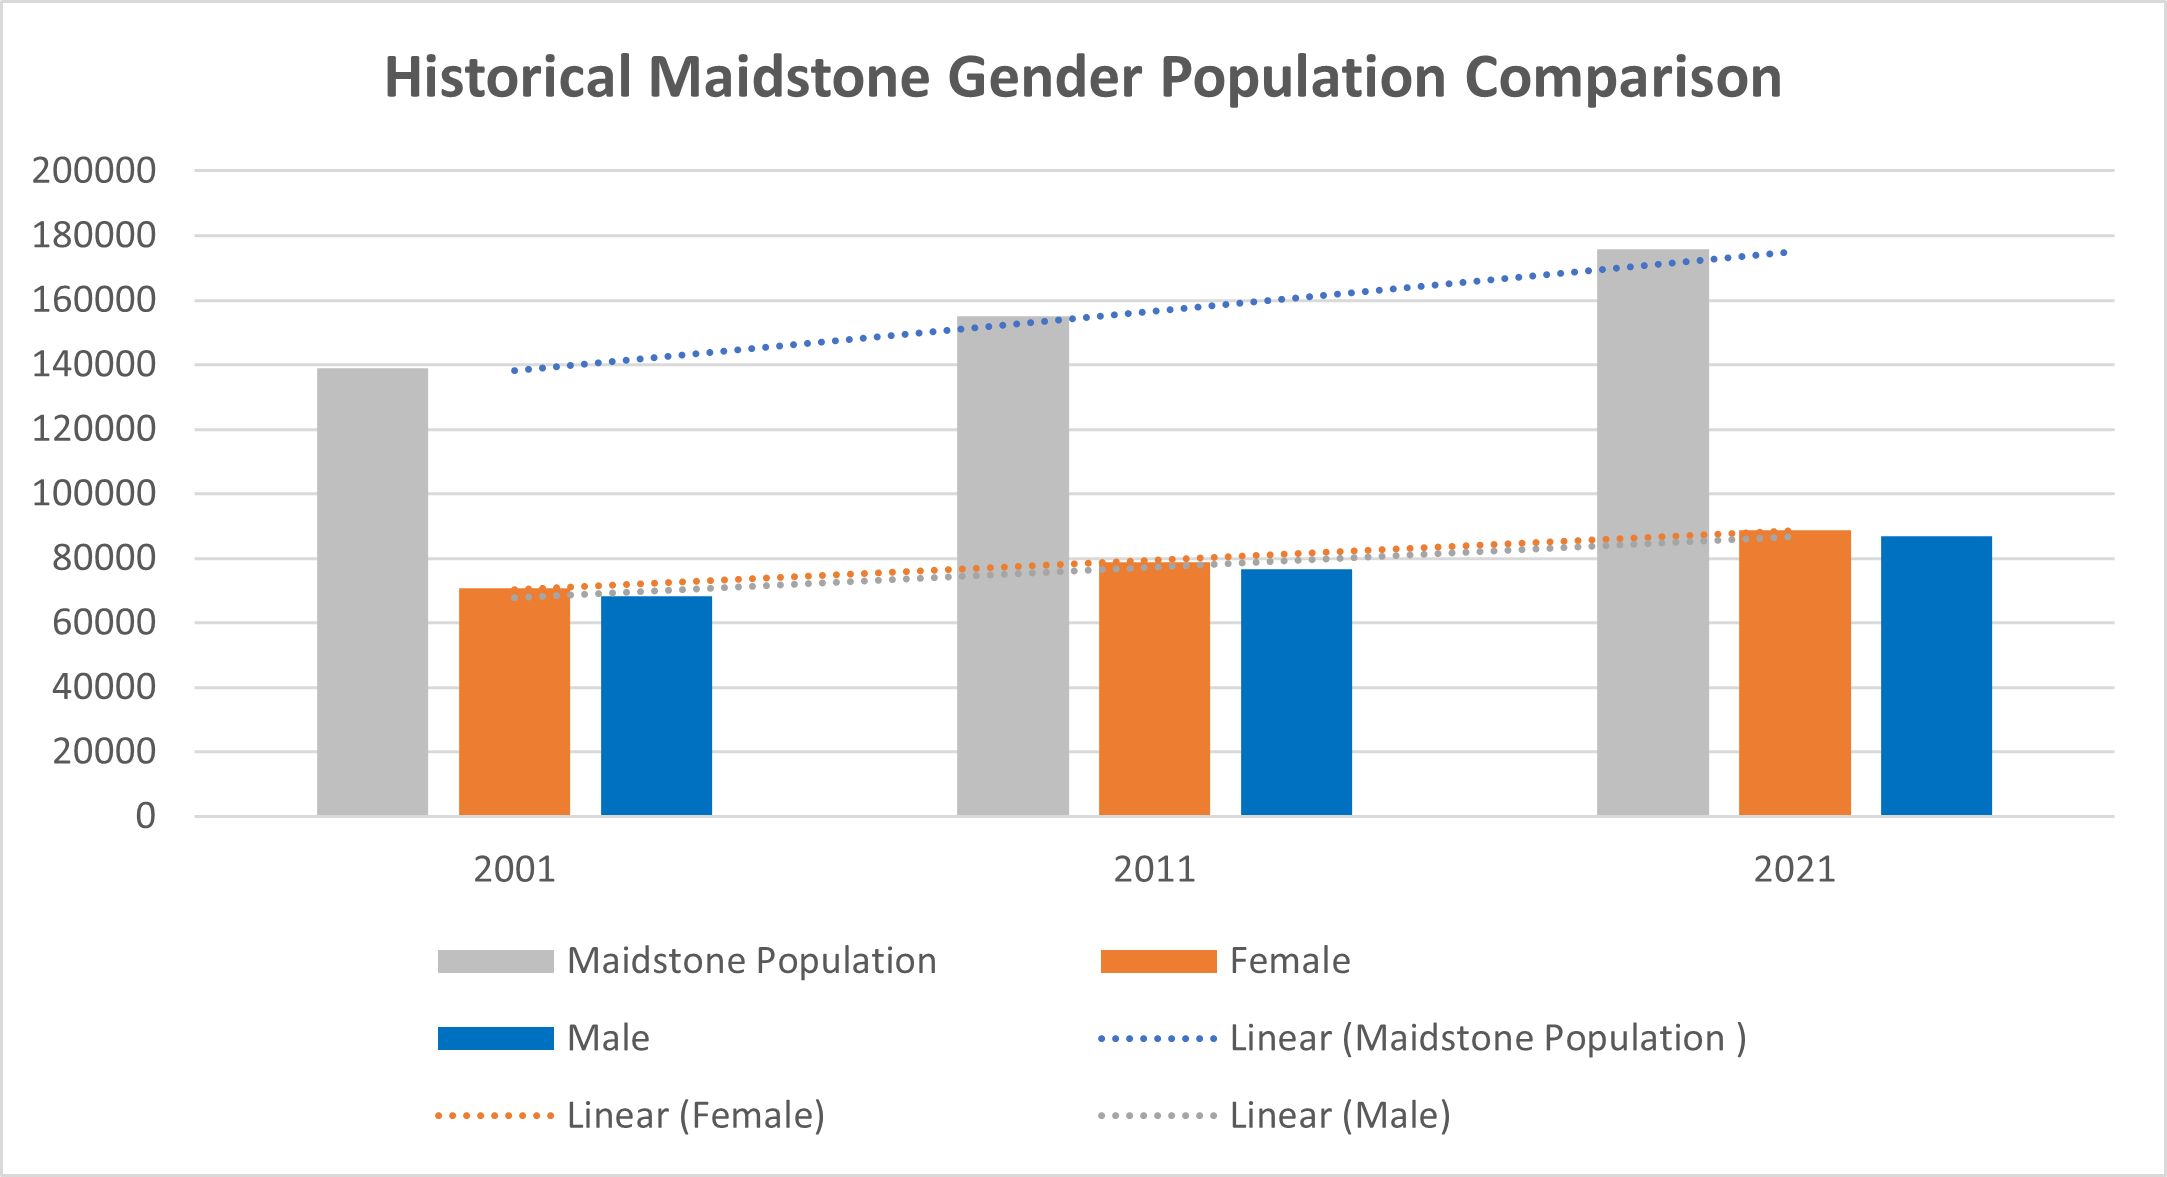
In Maidstone, as per Census 2021 data, there are 88,800 females (50.5% of the population) and 87,000 males (49.5% of the population).
The visualisation below represents statistics for Kent and all of the Kent districts, where females account for a marginally greater proportion of the population.

While the population in Maidstone saw a 13.3% growth against 2011, the female population grew by 12.9%, and the male population saw a growth of 13.7% against 2011 data.
Gender by age
Within the Maidstone population, there are more females (0.6%) at the age of 90 and above than men (0.3%) and this pattern is consistent in nearly all 5-year age groups above 30 years. However, in all 5-year age groups below 30 years, the male is the volume dominant gender in Maidstone.
Population density (number of usual residents per square kilometre)
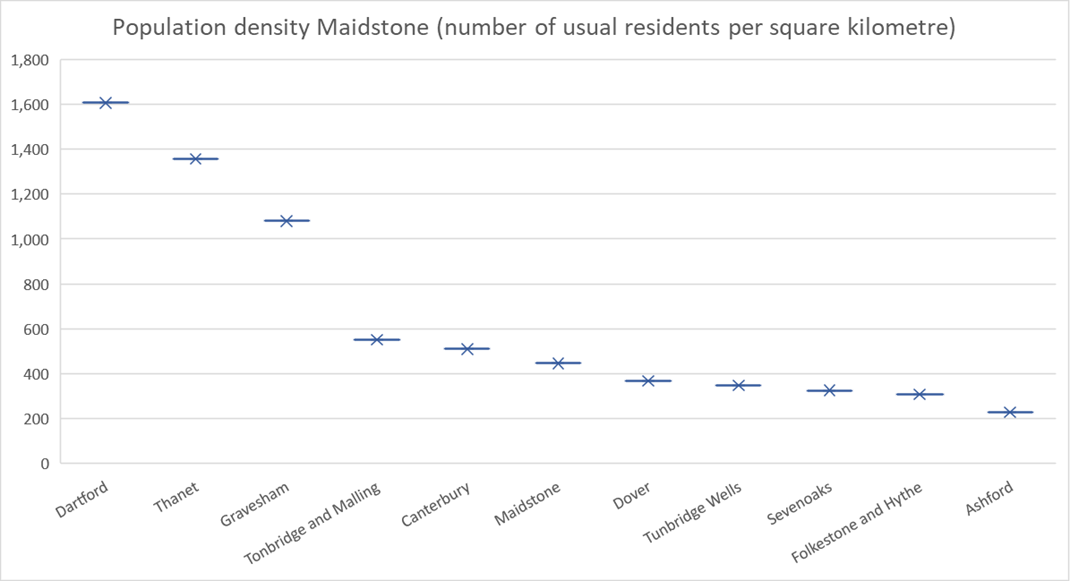
Population density for England and Wales increased from an average of 371 residents per square kilometre to 395 in 2021.
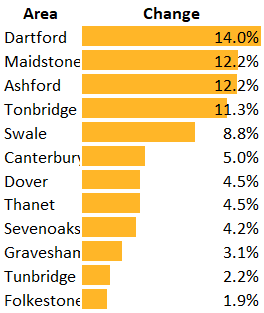
Maidstone’s population density is sixth to the highest in Kent (447) and saw a growth of 13.5% against 2011 result (394), which is the second-highest growth in Kent after Dartford.
Population density change since 2011
Household
The latest Census conducted on 21 March 2021 shows a 12.2% increase in the number of households with at least one usual resident in Maidstone – from 63,447 to 71,200. This means Maidstone has the largest number of households with at least one usual resident in the Kent area.
Households change since 2011
